View sync status and logs
The Sync status page tells you honestly what the last sync actually did — leading with what worked — and lets you act on any problems right there, without leaving the page.
Problems are counted as causes, not occurrences. A group that couldn't be updated will fail on every sync, so one problem can easily show up a thousand times in the raw log. Everywhere on these pages a cause is listed once, with how many times it happened alongside — "3 things to look at" means three causes, however many rows they produced. The raw totals are still there (as "didn't apply") for anyone who wants the scale.
Steps
Step 1 — Open Sync status
Select Sync status in the left sidebar.
Make sure you are in per-school mode (a school is selected in the switcher). In MAT mode, select a school first, or use the MAT sync overview button to see all schools at once.
Step 2 — Read the honest status header
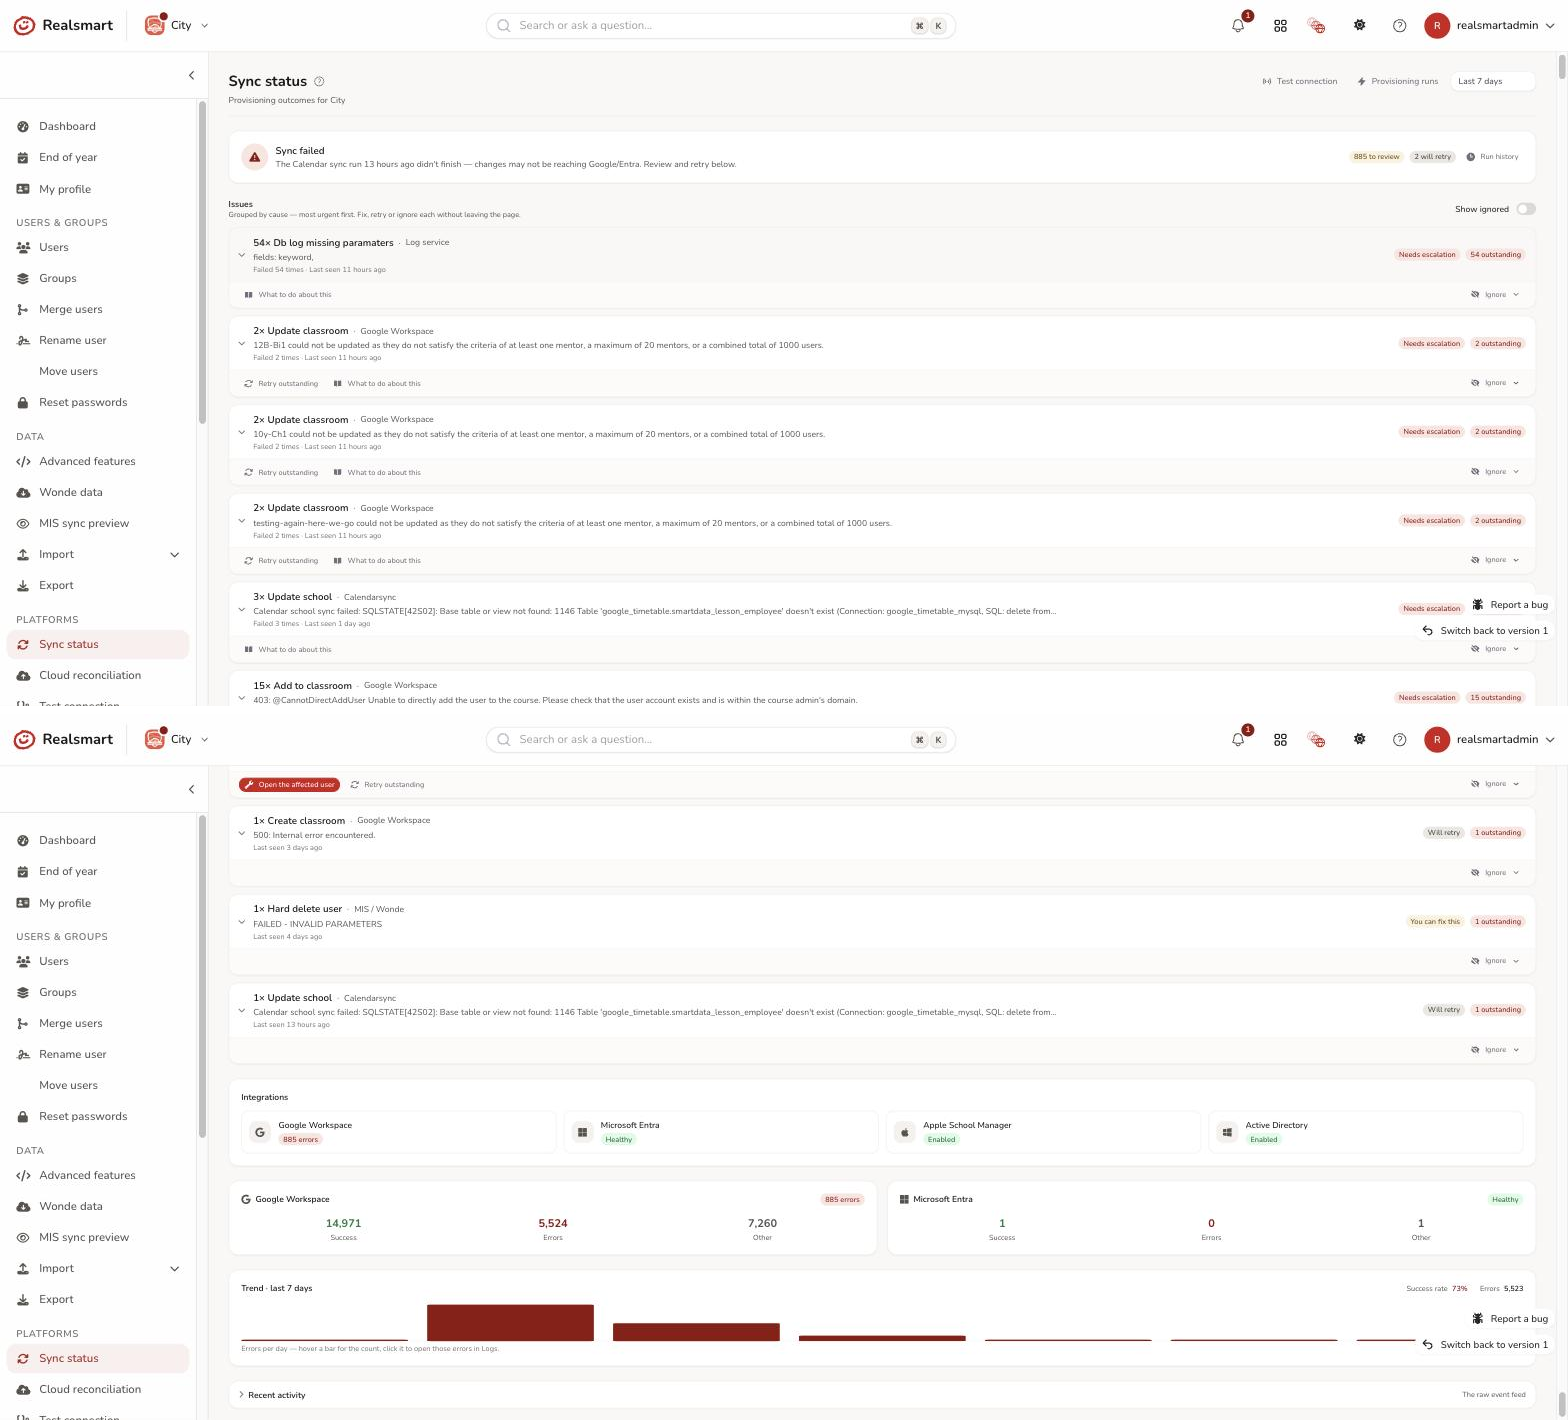
The banner at the top of the page states plainly what the last sync run actually did — it never labels a run "failed" just because some individual changes didn't apply:
| Header | Meaning |
|---|---|
| Sync is working | The last run finished and everything it tried was applied. The line underneath tells you when it ran and how many changes went through. Nothing to do. |
| Sync is working — a few things to look at | The run finished fine and applied its changes, but a handful of causes stopped some changes going through (bad data, a permission problem). The line underneath says how many changes applied and how many causes there are. See Step 3. |
| Sync didn't finish | The scheduled run applied its changes and then stopped before the end — a late step tripped after most of the work had gone through. Shown in amber, not red: it's worth knowing about, but changes were still reaching Google/Entra, and the next scheduled run re-runs the lot. |
| Sync failed | The scheduled sync run itself aborted before it applied anything (or stopped dead mid-run). Changes may not be reaching Google/Entra at all. This is the only state that's a real emergency and the only one shown in red; a one-off ad-hoc or preview job failing does not trigger it. Where we know the cause — an MIS connection that isn't authorised, for instance — the line says so instead of the general warning. |
| Sync running now | A provisioning run is in progress right now. |
| No recent sync runs | Nothing has run in the selected window — widen it, or check Trigger a manual sync. |
The badges next to the header count causes, one each:
- N to look at (gold) — causes you or your platform admin can do something about. This is the number that matters.
- N known issues — recognised patterns with their own review flow (e.g. orphaned classrooms).
- N will retry — temporary provider hiccups (rate limits, timeouts); the engine retries on its own.
- Realsmart is monitoring N — the provisioning engine's own self-checks. Nothing for you to do; Realsmart watches these.
Run history opens Provisioning runs for the full run-by-run detail.
If a notification bell brought you here, it deep-links straight to this page — and for a specific issue, straight to that issue's row in the panel below (it opens and scrolls into view automatically).
Step 3 — Act on issues right here
Further down, the Things to look at panel lists each cause the last sync couldn't apply, once, sorted most-urgent first — e.g. "Add to classroom ×48 — Permission denied" — the same grouping the Logs page uses, so the two surfaces always agree. The ×48 chip is how many times that one cause happened.
Click a row to expand it and see the affected users, the actual error message, and the raw detail. Each row carries a badge for how urgent it is (Needs escalation / You can fix this / Known issue / Will retry / Realsmart is monitoring), a still failing count, and an action strip:
- Fix — takes you to the existing screen that resolves that specific cause (e.g. the orphaned-classroom review, or the affected user's record). Never a fake button — if there's no real fix, you get guidance instead.
- Retry what's still failing — re-queues the still-failing items through the normal sync engine. Safe to use any time (it re-checks current state, so re-running something already fixed does nothing).
- Ignore — hides the row (current instances, or the whole cause going forward) without deleting anything. Reversible any time via Show ignored → Un-ignore.
Causes whose every instance has since succeeded on a later sync aren't mixed in with the live list — they're folded away underneath as "N causes sorted themselves out". Open it if you're curious; there's nothing to do.
See Understanding and actioning sync errors for exactly what each badge and action means, and what "Seen 47 times, last seen…" tells you.
Fixing, retrying to a successful outcome, or ignoring a cause here clears it from this panel and from the notification bell — they read the same underlying data, so they can't disagree.
Step 4 — Check the integrations panel
Further down, the Integrations summary shows one tile per connected platform (Google Workspace, Microsoft Entra, etc.), with a badge that speaks the same honest language as the Issues panel above it:
| Badge | Meaning |
|---|---|
| Healthy (green) | Activity happened and nothing is still failing |
| N to look at (gold) | N causes on this platform still need a look — see the Things to look at panel |
| N known issues | Only recognised, lower-urgency causes remain (e.g. orphaned classrooms) |
| N will retry | Only temporary causes remain — the engine will retry on its own |
| Realsmart monitoring | Only the engine's own self-checks remain — nothing for you to do |
| Not enabled (grey) | This platform is not configured for this school |
| No activity (grey) | Nothing happened for this platform in the selected window |
Step 5 — Check the per-platform summary
Each enabled platform also has a summary card for the selected time window, success first:
- Applied — changes that went through (green)
- Success rate — applied as a share of everything the sync tried
- Didn't apply — the raw number of changes that failed. This is occurrences, not causes, so it can be large while "to look at" is small.
Change the time window (Last 24 hours / Last 7 days / Last 30 days) using the dropdown in the top-right corner.
Sync activity over the window
The Sync activity card shows each day as one bar: what applied in green, with what didn't apply stacked on top in gold — so a week that was 95% fine looks 95% green. Hover a day for the numbers; click it to open that day's failures in Logs. The home dashboard's Sync centre shows the same as a compact 14-day sparkline, and the MAT sync status page shows a trust-wide version across all your schools.
Step 6 — Review the activity log
The Recent activity panel (collapsed by default, below the Trend card — click to expand) lists individual sync events:
| Column | Description |
|---|---|
| When | Date and time of the event |
| Platform | Google or Microsoft |
| Action | The type of change (e.g. "create user", "suspend user") |
| Affected | Who and what the change acted on — the user and, for membership changes, the group or classroom too (a membership change names both). Shown from the ids each log records; where an older row never captured them, it falls back to whatever the entry text holds. |
| Outcome | Success or the error message |
Step 7 — Deeper triage on the Logs page
The Logs page (in the sidebar) uses the same grouped-error view as the Things to look at panel above, but across a wider window and with more filters — reach for it when you need to search or filter beyond what's still failing right now. Its header reads the same way: how many changes applied, then how many causes to look at, with the raw "didn't apply" total underneath.
Two view modes sit next to the search box, so switching between them is one click — no need to open Filters:
- Grouped (default) — errors folded into one row per root cause, with the affected users, the badge and the Fix / Retry / Ignore actions.
- Table — one row per individual log entry: when, source, action, who it affected, and the outcome. Use this when you want the raw feed — to scan chronologically, to check a specific run, or to read successes and skips alongside failures. Where a failure kept repeating, the row shows its most recent time plus a ×N count, so a persistent problem never looks like a one-off. Admin edits to a user list each changed field with its new value, except credentials: a password, PIN, 2FA secret or QR code change is recorded as changed, never with the value.
Switching mode moves the Outcome filter with it, because the two answer different questions: Table shows all outcomes (the whole story, successes and skips included), and Grouped goes back to Errors (grouping by cause only applies to failures). Pick an outcome by hand afterwards and it stays put.
The view you pick is part of the page address, so you can bookmark or share a link straight to the table view.
Use the filters to narrow results:
- Platform: all platforms that have activity (Google Workspace, Microsoft Entra, Active Directory)
- Outcome: Errors (default) / Success / Skipped (unchanged) — skips are hidden by default because they are normal "nothing changed" events
- Time window, Action (e.g. Add to classroom), User (username), free-text Search, and Sort
To investigate a specific user, type their username into the User filter.
Step 8 — See provisioning runs
For a higher-level view, open Provisioning runs (the button in the top-right of the Sync status page, or Run history next to the status header). Where the activity log lists individual events, this page groups them into runs — one execution of a scheduled command or an admin-triggered sync:
- In progress — runs happening right now. This panel refreshes automatically, so after you trigger a manual sync you can watch it run here. Use Pause live to stop the auto-refresh.
- Last run per command — the most recent run of each command, with its status, how long it took, and what it changed (e.g. "5 updated · 1 error").
- Recent runs — a feed of completed runs, filterable by command and by status (Success / Failed / Skipped). The Detail column shows the error or the reason a run was skipped.
"Skipped" is normal — it usually means the school was outside its provisioning date window, or a sync option is turned off for that school.
Step 9 — See the live queue
Open Queue (under Sync status) to see the sync work queue in real time — the jobs the provisioning service has waiting or in-flight, rather than the runs that have already finished:
- Running now — jobs a worker is processing this moment (auto-refreshing; use Pause live to stop).
- Queued — jobs enqueued and waiting their turn.
- Recently completed — jobs that just finished or failed, with how long they took.
A per-integration summary shows how many Google / Microsoft jobs are running or queued. In MAT Overview the Queue is trust-wide (all your schools, plus shared infrastructure jobs); per school it shows only that school's jobs.
Step 10 — See when things run
Open Schedule (under Sync status) to see when each sync task runs — the MIS fetch, the Google and Microsoft provision passes, and housekeeping — with its cron timing and the next time it is due. Filter by integration to answer "when does Google next sync?" without asking an engineer. The list is published by the provisioning service itself, so it always matches what actually runs.
See what the origin says
The logs show what the sync did. To see what the source says — the MIS, via Wonde — open Wonde data; it helps you tell whether a problem is in the source data or the sync. Match the MIS ID shown there against the logs.
Troubleshooting
- "It says thousands didn't apply but only 3 things to look at" — that's the cause count doing its job: one broken group fails once per sync, per member, so a single cause can produce hundreds of rows. Fix the three causes and the big number stops climbing.
- "I see errors but the users look fine in Google" — some errors are transient (temporary API failures that succeed on retry). Check whether the same user shows later successes — the row will say since succeeded.
- "The log is empty" — try extending the time window to Last 7 days. If still empty, syncing may not have run or no platforms are connected.
- "I see errors for a specific user" — see User not syncing — troubleshooting.
- "The header says 'Sync failed' but I only see a handful of old errors" — "Sync failed" only ever means the scheduled run itself aborted, never that some individual changes had problems; if you're seeing that header, check Provisioning runs for what actually happened.
- "It says Realsmart isn't authorised to read our MIS data" — the connection between Realsmart and your MIS (through Wonde) has not been approved, or the approval has lapsed. Nothing on this page can fix it and there is nothing to retry: contact Realsmart support and we'll get the connection re-approved. The same applies to "the MIS reference held for this school doesn't exist in Wonde" — that one is a setting at our end.
- "What's the difference between 'Sync failed' and 'Sync didn't finish'?" — Sync failed (red) means the run never applied anything. Sync didn't finish (amber) means the run did its work and then stopped before the end, so your changes went through; the next scheduled run repeats the whole thing anyway.
Related
Was this guide helpful?
We read every response — it decides what we rewrite next.
Thanks for your feedback.